This report was recently updated on April 11 2024 with the latest and most recent
market numbers
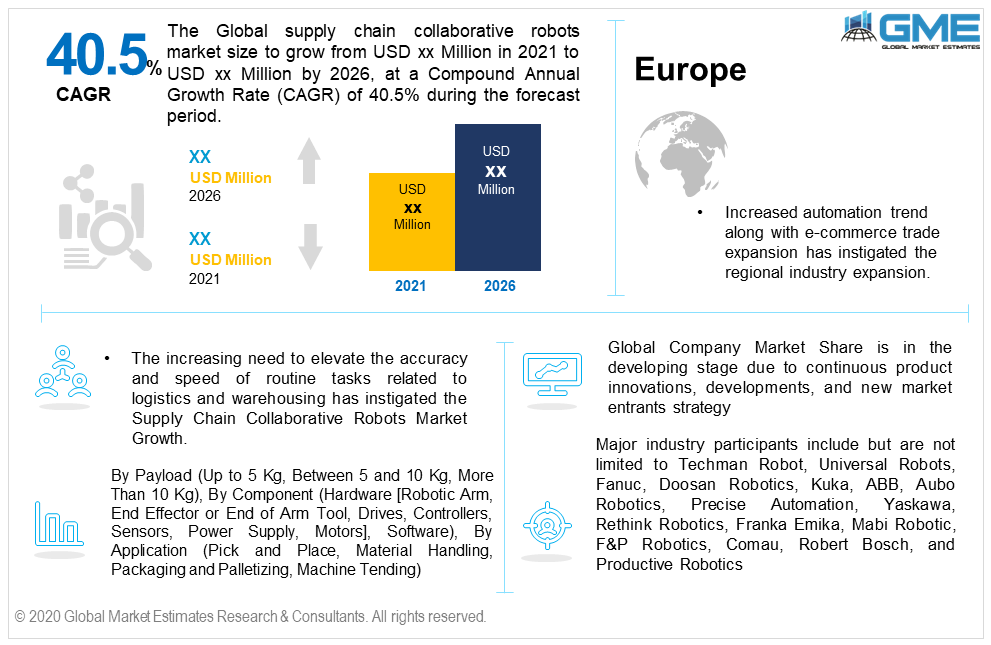
Global Supply Chain Collaborative Robots Market Size, Trends & Analysis - Forecasts to 2026 By Payload (Up to 5 Kg, Between 5 and 10 Kg, More Than 10 Kg), By Component (Hardware [Robotic Arm, End Effector or End of Arm Tool, Drives, Controllers, Sensors, Power Supply, Motors], Software), By Application (Pick and Place, Material Handling, Packaging and Palletizing, Machine Tending), By Region (North America, Asia Pacific, Europe, Latin America, Middle East & Africa); End-User Landscape, Company Market Share Analysis, and Competitor Analysis
The increasing need to elevate the accuracy and speed of routine tasks related to logistics and warehousing has instigated the supply chain collaborative robots market growth. Another factor such as worker’s safety related to hazardous working environment has resulted in high demand for cobots in pick & place and material handling applications.
The global supply chain collaborative robots market will grow at more than 40.5% CAGR from 2021 to 2026, with Europe dominating the regional demand. Cobots are advanced solutions to both small and large-scale businesses as they are comparatively less in cost and have a higher return on investment as compared to their industrial counterparts.
Covid-19 pandemic has resulted in a drastic shift towards robotic process and automation in diversified applications. The most impacted one is the e-commerce trade, increasing the need to obtain sustenance in the logistic industry as the majority of the shopping was shifted to the online sales channel. Thus, the advancement of the supply chain is necessary to continue the operations. These cobots can easily reduce the over-dependency on humans in some tasks.
Up to 5 Kg, between 5 to 10 Kg, and more than 10 Kg are three payload cobots present in the market. Cobots with up to 5 Kg capacity dominated the payload segment and are projected to hold their dominance during the forecast period. Economical pricing and compact physical structure are among the key success factors to drive demand for these cobots. Hassle-free integration and ease of operation make the product highly beneficial for first-time users.
Logistic companies are investing heavily in automation and artificial intelligence solutions to optimize the overall process. Covid-19 has also impacted the business processes, especially in the e-commerce trade industry. Now, the companies are working to minimize the dependency on the human workforce on repetitive work such as palletizing, packaging, and pick & place.
By component, the market is divided into hardware and software. Further, hardware components are subdivided into the robotic arm, drives, end effector or end of arm tool (EOAT), controllers, power supply, sensors, and motors.
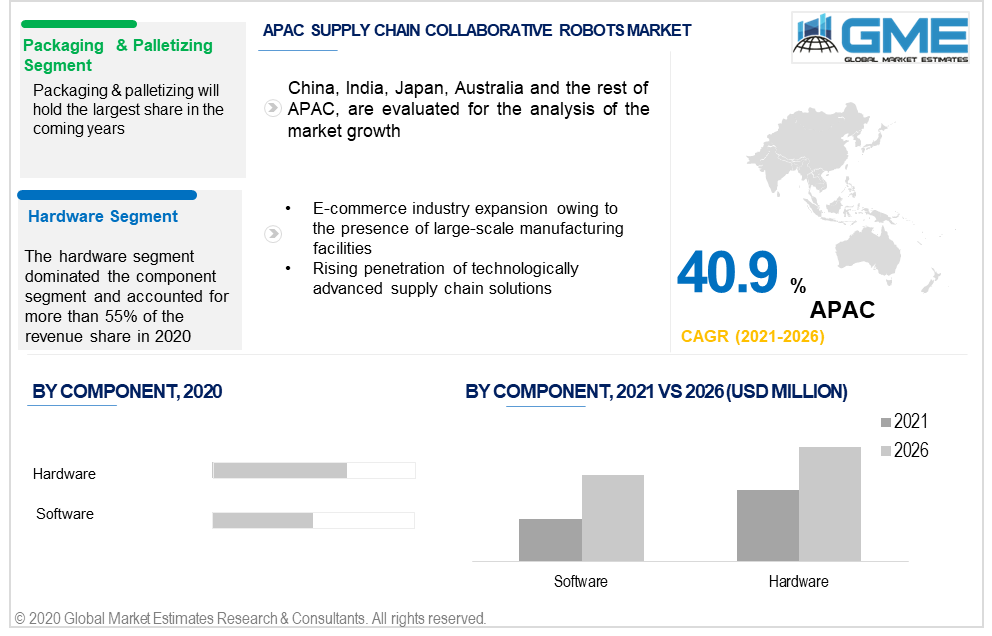
The hardware segment dominated the component segment and accounted for more than 55% of the revenue share in 2019. Components such as robotic arm, controller, and end effector or end of arm tool (EOAT) were among the highly procured components in the industry.
The software segment is intended to grow at the fastest rate from 2021 to 2026. Increasing cobots manufacturers' interest in investment and development of intuitive software to enhance the user experience will result in high penetration.
By application, the industry is comprised of pick and place, material handling, packaging & palletizing, and machine tending. Packaging & palletizing will hold the largest share in the coming years. Repetitive tasks by humans become mundane and lead to errors and damage. Thus, the deployment of cobots eased the overall process and helped in achieving time and cost-efficiency. Processes such as pick and place are also taken over by the highly efficient cobots to reduce the burden on the human workforce.
Another important task that is successfully performed by cobots is machine tending. This monotonous task required the worker to stand beside the machines for a longer duration. But, with the help of cobots the task can be automated without supervision.
The rising need to optimize the in-house logistics operation and increase productivity has resulted in the adoption of cobots in handling tasks.
The European market dominated the regional demand and accounted for more than 35% of the revenue share in 2019. Increased automation trend along with e-commerce trade expansion has instigated the regional industry expansion. The UK, Germany, Netherlands, and France are among the major contributor in the region in terms of deployment.
The Asia Pacific Market is intended to attain the highest gains from 2021 to 2026. E-commerce industry expansion owing to the presence of large-scale manufacturing facilities will support the regional industry growth. Inclination towards automation and artificial intelligence across various industries will induce cobot penetration. The presence of large-scale regional players such as Techman Robot from Taiwan and Doosan Robotics from South Korea are advanced enough to compete with European players. Also, the presence of low-budget cobots from Chinese players such as Han’s, Elephant Robotics, and Siasun open opportunities for small-scale traders as well.
North America will grow at a significant rate during the forecast period. Shifting trends towards robotic solutions in in-house logistics to reduce the dependency on the human workforce will result in high cobots penetration.
Global Company Market Share is in the developing stage due to continuous product innovations, developments, and new market entrants strategy. As of now, only a few vendors provide the cobots for diversified applications. However, the increasing trend of automation and investment in artificial intelligence has inspired various companies to invest and collaborate in the cobot market. Mergers and acquisitions with start-up companies are witnessed in the industry.
Major industry participants include but are not limited to Techman Robot, Universal Robots, Fanuc, Doosan Robotics, Kuka, ABB, Aubo Robotics, Precise Automation, Yaskawa, Rethink Robotics, Franka Emika, Mabi Robotic, F&P Robotics, Comau, Robert Bosch, and Productive Robotics.
Please note: This is not an exhaustive list of companies profiled in the report.
Chapter 1 Methodology
1.1 Market scope & definitions
1.2 Estimates & forecast calculation
1.3 Historical data overview and validation
1.4 Data sources
1.4.1 Secondary
1.4.2 Primary
Chapter 2 Report Outlook
2.1 Supply chain collaborative robots industry overview, 2019-2026
2.1.1 Industry overview
2.1.2 Payload overview
2.1.3 Component overview
2.1.4 Application overview
2.1.5 Regional overview
Chapter 3 Supply Chain Collaborative Robots Market Trends
3.1 Market segmentation
3.2 Industry background, 2019-2026
3.3 Market key trends
3.3.1 Positive trends
3.3.2 Industry challenges
3.4 Prospective growth scenario
3.5 COVID-19 influence over industry growth
3.6 Porter’s analysis
3.7 PESTEL analysis
3.8 Value chain & supply chain analysis
3.9 Regulatory framework
3.9.1 North America
3.9.2 Europe
3.9.3 APAC
3.9.4 LATAM
3.9.5 MEA
3.10 Technology overview
3.11 Market share analysis, 2020
3.11.1 Company positioning overview, 2020
Chapter 4 Supply Chain Collaborative Robots Market, By Payload
4.1 Payload Outlook
4.2 Up To 5 Kg
4.2.1 Market size, by region, 2019-2026 (USD Million)
4.3 Between 5 And 10 Kg
4.3.1 Market size, by region, 2019-2026 (USD Million)
4.4 More Than 10 Kg
4.4.1 Market size, by region, 2019-2026 (USD Million)
Chapter 5 Supply Chain Collaborative Robots Market, By Component
5.1 Component Outlook
5.2 Hardware
5.2.1 Market size, by region, 2019-2026 (USD Million)
5.2.2 Robotic Arms
5.2.2.1 Market size, by region, 2019-2026 (USD Million)
5.2.3 End Effector Or End Of Arm Tool (EOAT)
5.2.3.1 Market size, by region, 2019-2026 (USD Million)
5.2.4 Drives
5.2.4.1 Market size, by region, 2019-2026 (USD Million)
5.2.5 Controllers
5.2.5.1 Market size, by region, 2019-2026 (USD Million)
5.2.6 Sensors
5.2.6.1 Market size, by region, 2019-2026 (USD Million)
5.2.7 Power Supply
5.2.7.1 Market size, by region, 2019-2026 (USD Million)
5.2.8 Motors
5.2.8.1 Market size, by region, 2019-2026 (USD Million)
5.2.9 Others
5.2.9.1 Market size, by region, 2019-2026 (USD Million)
5.3 Software
5.3.1 Market size, by region, 2019-2026 (USD Million)
Chapter 6 Supply Chain Collaborative Robots Market, By Application
6.1 Application Outlook
6.2 Pick and Place
6.2.1 Market size, by region, 2019-2026 (USD Million)
6.3 Material Handling
6.3.1 Market size, by region, 2019-2026 (USD Million)
6.4 Packaging and Palletizing
6.4.1 Market size, by region, 2019-2026 (USD Million)
6.5 Machine Tending
6.5.1 Market size, by region, 2019-2026 (USD Million)
6.6 Others
6.6.1 Market size, by region, 2019-2026 (USD Million)
Chapter 7 Supply Chain Collaborative Robots Market, By Region
7.1 Regional outlook
7.2 North America
7.2.1 Market size, by country 2019-2026 (USD Million)
7.2.2 Market size, by payload, 2019-2026 (USD Million)
7.2.3 Market size, by component, 2019-2026 (USD Million)
7.2.4 Market size, by application, 2019-2026 (USD Million)
7.2.5 U.S.
7.2.5.1 Market size, by payload, 2019-2026 (USD Million)
7.2.5.2 Market size, by component, 2019-2026 (USD Million)
7.2.5.3 Market size, by application, 2019-2026 (USD Million)
7.2.6 Canada
7.2.6.1 Market size, by payload, 2019-2026 (USD Million)
7.2.6.2 Market size, by component, 2019-2026 (USD Million)
7.2.6.3 Market size, by application, 2019-2026 (USD Million)
7.2.7 Mexico
7.2.7.1 Market size, by payload, 2019-2026 (USD Million)
7.2.7.2 Market size, by component, 2019-2026 (USD Million)
7.2.7.3 Market size, by application, 2019-2026 (USD Million)
7.3 Europe
7.3.1 Market size, by country 2019-2026 (USD Million)
7.3.2 Market size, by payload, 2019-2026 (USD Million)
7.3.3 Market size, by component, 2019-2026 (USD Million)
7.3.4 Market size, by application, 2019-2026 (USD Million)
7.3.5 Germany
7.2.5.1 Market size, by payload, 2019-2026 (USD Million)
7.2.5.2 Market size, by component, 2019-2026 (USD Million)
7.2.5.3 Market size, by application, 2019-2026 (USD Million)
7.3.6 Spain
7.3.6.1 Market size, by payload, 2019-2026 (USD Million)
7.3.6.2 Market size, by component, 2019-2026 (USD Million)
7.3.6.3 Market size, by application, 2019-2026 (USD Million)
7.3.7 France
7.3.7.1 Market size, by payload, 2019-2026 (USD Million)
7.3.7.2 Market size, by component, 2019-2026 (USD Million)
7.3.7.3 Market size, by application, 2019-2026 (USD Million)
7.3.8 Italy
7.3.8.1 Market size, by payload, 2019-2026 (USD Million)
7.3.8.2 Market size, by component, 2019-2026 (USD Million)
7.3.8.3 Market size, by application, 2019-2026 (USD Million)
7.4 Asia Pacific
7.4.1 Market size, by country 2019-2026 (USD Million)
7.4.2 Market size, by payload, 2019-2026 (USD Million)
7.4.3 Market size, by component, 2019-2026 (USD Million)
7.4.4 Market size, by application, 2019-2026 (USD Million)
7.4.5 China
7.4.5.1 Market size, by payload, 2019-2026 (USD Million)
7.4.5.2 Market size, by component, 2019-2026 (USD Million)
7.4.5.3 Market size, by application, 2019-2026 (USD Million)
7.4.6 India
7.4.6.1 Market size, by payload, 2019-2026 (USD Million)
7.4.6.2 Market size, by component, 2019-2026 (USD Million)
7.4.6.3 Market size, by application, 2019-2026 (USD Million)
7.4.7 Malaysia
7.4.7.1 Market size, by payload, 2019-2026 (USD Million)
7.4.7.2 Market size, by component, 2019-2026 (USD Million)
7.4.7.3 Market size, by application, 2019-2026 (USD Million)
7.4.8 Australia
7.4.8.1 Market size, by payload, 2019-2026 (USD Million)
7.4.8.2 Market size, by component, 2019-2026 (USD Million)
7.4.8.3 Market size, by application, 2019-2026 (USD Million)
7.4.9 South Korea
7.4.9.1 Market size, by payload, 2019-2026 (USD Million)
7.4.9.2 Market size, by component, 2019-2026 (USD Million)
7.4.9.3 Market size, by application, 2019-2026 (USD Million)
7.5 Central & South America
7.5.1 Market size, by country 2019-2026 (USD Million)
7.5.2 Market size, by payload, 2019-2026 (USD Million)
7.5.3 Market size, by component, 2019-2026 (USD Million)
7.5.4 Market size, by application, 2019-2026 (USD Million)
7.5.5 Brazil
7.5.5.1 Market size, by payload, 2019-2026 (USD Million)
7.5.5.2 Market size, by component, 2019-2026 (USD Million)
7.5.5.3 Market size, by application, 2019-2026 (USD Million)
7.5.6 Argentina
7.5.6.1 Market size, by payload, 2019-2026 (USD Million)
7.5.6.2 Market size, by component, 2019-2026 (USD Million)
7.5.6.3 Market size, by application, 2019-2026 (USD Million)
7.6 MEA
7.6.1 Market size, by country 2019-2026 (USD Million)
7.6.2 Market size, by payload, 2019-2026 (USD Million)
7.6.3 Market size, by component, 2019-2026 (USD Million)
7.6.4 Market size, by application, 2019-2026 (USD Million)
7.6.5 Saudi Arabia
7.6.5.1 Market size, by payload, 2019-2026 (USD Million)
7.6.5.2 Market size, by component, 2019-2026 (USD Million)
7.6.5.3 Market size, by application, 2019-2026 (USD Million)
7.6.6 UAE
7.6.6.1 Market size, by payload, 2019-2026 (USD Million)
7.6.6.2 Market size, by component, 2019-2026 (USD Million)
7.6.6.3 Market size, by application, 2019-2026 (USD Million)
7.6.7 South Africa
7.6.7.1 Market size, by payload, 2019-2026 (USD Million)
7.6.7.2 Market size, by component, 2019-2026 (USD Million)
7.6.7.3 Market size, by application, 2019-2026 (USD Million)
Chapter 8 Company Landscape
8.1 Competitive analysis, 2020
8.2 Universal Robots
8.2.1 Company overview
8.2.2 Financial analysis
8.2.3 Strategic positioning
8.2.4 Info graphic analysis
8.3 Techman Robot
8.3.1 Company overview
8.3.2 Financial analysis
8.3.3 Strategic positioning
8.3.4 Info graphic analysis
8.4 Fanuc
8.4.1 Company overview
8.4.2 Financial analysis
8.4.3 Strategic positioning
8.4.4 Info graphic analysis
8.5 Kuka
8.5.1 Company overview
8.5.2 Financial analysis
8.5.3 Strategic positioning
8.5.4 Info graphic analysis
8.6 Doosan Robotics
8.6.1 Company overview
8.6.2 Financial analysis
8.6.3 Strategic positioning
8.6.4 Info graphic analysis
8.7 Aubo Robotics
8.7.1 Company overview
8.7.2 Financial analysis
8.7.3 Strategic positioning
8.7.4 Info graphic analysis
8.8 ABB
8.8.1 Company overview
8.8.2 Financial analysis
8.8.3 Strategic positioning
8.8.4 Info graphic analysis
8.9 Yaskawa
8.9.1 Company overview
8.9.2 Financial analysis
8.9.3 Strategic positioning
8.9.4 Info graphic analysis
8.10 Precise Automation
8.10.1 Company overview
8.10.2 Financial analysis
8.10.3 Strategic positioning
8.10.4 Info graphic analysis
8.11 Rethink Robotics
8.11.1 Company overview
8.11.2 Financial analysis
8.11.3 Strategic positioning
8.11.4 Info graphic analysis
8.12 Mabi Robotic
8.12.1 Company overview
8.12.2 Financial analysis
8.12.3 Strategic positioning
8.12.4 Info graphic analysis
8.13 Franka Emika
8.13.1 Company overview
8.13.2 Financial analysis
8.13.3 Strategic positioning
8.13.4 Info graphic analysis
8.14 Comau
8.14.1 Company overview
8.14.2 Financial analysis
8.14.3 Strategic positioning
8.14.4 Info graphic analysis
8.15 F&P Robotics
8.15.1 Company overview
8.15.2 Financial analysis
8.15.3 Strategic positioning
8.15.4 Info graphic analysis
8.16 Stäubli
8.16.1 Company overview
8.16.2 Financial analysis
8.16.3 Strategic positioning
8.16.4 Info graphic analysis
8.17 Robert Bosch
8.17.1 Company overview
8.17.2 Financial analysis
8.17.3 Strategic positioning
8.17.4 Info graphic analysis
8.18 Productive Robots
8.18.1 Company overview
8.18.2 Financial analysis
8.18.3 Strategic positioning
8.18.4 Info graphic analysis
The Global Supply Chain Collaborative Robots Market has been studied from the year 2019 till 2026. However, the CAGR provided in the report is from the year 2021 to 2026. The research methodology involved three stages: Desk research, Primary research, and Analysis & Output from the entire research process.

The desk research involved a robust background study which meant referring to paid and unpaid databases to understand the market dynamics; mapping contracts from press releases; identifying the key players in the market, studying their product portfolio, competition level, annual reports/SEC filings & investor presentations; and learning the demand and supply-side analysis for the Supply Chain Collaborative Robots Market.

The primary research activity included telephonic conversations with more than 50 tier 1 industry consultants, distributors, and end-use product manufacturers.

Finally, based on the above thorough research process, an in-depth analysis was carried out considering the following aspects: market attractiveness, current & future market trends, market share analysis, SWOT analysis of the company and customer analytics.

Frequently Asked Questions
![Global Supply Chain Collaborative Robots Market Size, Trends & Analysis - Forecasts to 2026 By Payload (Up to 5 Kg, Between 5 and 10 Kg, More Than 10 Kg), By Component (Hardware [Robotic Arm, End Effector or End of Arm Tool, Drives, Controllers, Sensors, Power Supply, Motors], Software), By Application (Pick and Place, Material Handling, Packaging and Palletizing, Machine Tending), By Region (North America, Asia Pacific, Europe, Latin America, Middle East & Africa); End-User Landscape, Company Market Share Analysis, and Competitor Analysis](https://www.globalmarketestimates.com/images/cat/Trending Technology.png)
This FREE sample includes market data points, ranging from trend analyses to market estimates & forecasts. See for yourself.
Or view our licence options:
Tailor made solutions just for you
80% of our clients seek made-to-order reports. How do you want us to tailor yours?
OUR CLIENTS


