

Abstract
Extreme event attribution aims to elucidate the link between global climate change, extreme weather events, and the harms experienced on the ground by people, property, and nature. It therefore allows the disentangling of different drivers of extreme weather from human-induced climate change and hence provides valuable information to adapt to climate change and to assess loss and damage. However, providing such assessments systematically is currently out of reach. This is due to limitations in attribution science, including the capacity for studying different types of events, as well as the geographical heterogeneity of both climate and impact data availability. Here, we review current knowledge of the influences of climate change on five different extreme weather hazards (extreme temperatures, heavy rainfall, drought, wildfire, tropical cyclones), the impacts of recent extreme weather events of each type, and thus the degree to which various impacts are attributable to climate change. For instance, heat extremes have increased in likelihood and intensity worldwide due to climate change, with tens of thousands of deaths directly attributable. This is likely a significant underestimate due to the limited availability of impact information in lower- and middle-income countries. Meanwhile, tropical cyclone rainfall and storm surge height have increased for individual events and across all basins. In the North Atlantic basin, climate change amplified the rainfall of events that, combined, caused half a trillion USD in damages. At the same time, severe droughts in many parts of the world are not attributable to climate change. To advance our understanding of present-day extreme weather impacts due to climate change developments on several levels are required. These include improving the recording of extreme weather impacts around the world, improving the coverage of attribution studies across different events and regions, and using attribution studies to explore the contributions of both climate and non-climate drivers of impacts.
Export citation and abstract BibTeX RIS

Original content from this work may be used under the terms of the Creative Commons Attribution 4.0 license. Any further distribution of this work must maintain attribution to the author(s) and the title of the work, journal citation and DOI.
1. Introduction
Every year, climate change manifests through more intense extreme weather events, including heatwaves, droughts and heavy rainfall. This leads to impacts upon people, property and nature that would not have occurred in the absence of these increases in events' likelihood and intensity. Unlike some other impacts of climate change, extreme weather events are manifesting on immediate timescales and changes in extremes are poorly described by the climatological means studied in many projections. Unfortunately, there is currently no standardised way of, or effort towards, documenting climate change related harms systematically. As a result, there is no systematic basis to quantify the major contribution of human influence on extreme weather to the costs of climate change. This contributes to the challenge that measures taken to mitigate and adapt to current (of ∼1.20 °C at the time of writing (Masson-Delmotte et al 2021)) and future levels of global warming are not based on what could be the best available evidence.
Extreme event attribution is the method through which the role of climate change in an individual event can be assessed and quantified (Allen 2003, Philip et al 2020, van Oldenborgh et al 2021). Over the past two decades, more than 350 studies have quantified the role of climate change in over 400 extreme events (Carbon Brief 2021). This growing body of evidence is complementary to other analysis, such as work documenting observed and modelled trends in extremes due to climate change, and projections of future risk. The evidence from attribution studies adds value by highlighting the role of climate as a risk driver in experienced events, which in turn is useful for building future resilience (Raju et al 2022), and it enables the attribution of impacts, which is useful for cost-benefit analysis of mitigation and is a potential avenue for the exploration of drivers of loss and damage from climate-related extremes (James et al 2019). There is currently very little discussion of the role of science in determining loss and damage from anthropogenic climate change.
However, the number of events that have been studied using attribution methods is just a small fraction of all impactful extreme weather events that occurred over the same period. It is almost impossible to document this comprehensively due to data, time and resource constraints (Harrington and Otto 2020, van Oldenborgh et al 2021). Furthermore, these studies overwhelmingly focus on events that occurred in the global north (Otto et al 2020a). This pattern is mirrored in the unequal recording of impacts from extreme events, although nations in the global south are experiencing the most rapid changes in risk (Byers et al 2018) and often have high levels of underlying exposure and vulnerability to climate-related events.
The Sixth Assessment Report (AR6) of the Intergovernmental Panel on Climate Change (IPCC) provides a synthesis of attributable changes in extremes in regions across the world (Masson-Delmotte et al 2021). This forms a core part of the evidence base in this literature review. However, in order to link regional assessments of attributable risk to impacts that have occurred, it is necessary to compile attribution statements for individual events. In doing so this review builds on the IPCC assessment, linking broad changes in hazards to the ways in which these manifest and interact with exposure and vulnerability, and result in tangible impacts, with a bottom-up methodology, in which we develop insight into human influence on assessed extreme weather event categories based on literature on individual events. Further, the distinction between regional assessment and individual events is particularly important in adding evidence for more complex events, such as droughts, and at smaller spatial scales than the IPCC's regional aggregations, at which other phenomena may affect the influence of climate change.
Overall, the review brings together the best evidence we have on changes in extreme weather hazards and the impacts of past events, covering five key hazards: heatwaves, rainfall-based flooding, droughts, wildfires, and tropical cyclones. It is important to note that several of these hazards fall along different parts of the causative chain that stretches from anthropogenic climate change to impacts; each was selected as an appropriate intersection between attribution science and impact-relevance. As such, for each hazard, we assess the degree to which past impacts can be attributed to anthropogenic climate change, and the limiting factors associated with this. In doing so, we also build a picture of where evidence is most lacking, and therefore most urgent, for both attribution science and the documenting of impacts.
Each hazard section is laid out as follows. First, we describe attributed changes in extremes on global and regional scales, then how individual event attribution fits within this. Second, we discuss why it matters, describing the causative chain that results in key impacts arising due to such hazards. Finally, we discuss the 'attributable impacts' for each hazard. The intent of this subsection is not to suggest that the impacts of an event with any degree of anthropogenic influence, no matter the scale, are all attributable to climate change. Instead, these sections contain individual attribution statements alongside the impacts of those events, in the context of their connections as described previously. This should be interpreted as a snapshot, constrained by the body of existing attribution statements and to date, of the types and magnitude of impacts that have manifested to some degree by anthropogenic climate change. We posit that this is currently the most we can know based on existing evidence. And, in the absence of science to accurately attribute impacts using an end-to-end system for every event (and understanding that a fractional attributable risk (FAR)-based attribution of impacts is most applicable to classes of event (Perkins-Kirkpatrick et al 2022)) this is nonetheless more useful than neglecting to combine such information at all. Tables 1 and 2 summarise this information on a global scale.
Table 1. Direct physical health impacts of different types of disaster between 2000 and 2020, as recorded by EMDAT, and the attributable influence of climate change on each hazard (EMDAT 2019).
| Observed direct impacts | Attributable influence of climate change on hazard severity/likelihood (confidence level) | |||
|---|---|---|---|---|
| Hazard | Deaths | Injured | Total affected | |
| Heatwaves | 157 000 | 193 000 | 320 000 | Increase (high) |
| Cold waves and severe winter conditions | 14 900 | 1.86 million | 96.1 million | Decrease (high) |
| Floods | 111 000 | 304 000 | 1.66 billion | Increase (medium) |
| Droughts | 21 300 | N/A | 1.44 billion | Increase (medium) |
| Wildfires | 1570 | 7260 | 3.38 million | Increase (medium) |
| Storms | 201 000 | 337 000 | 773 million | Rainfall increase (high) Other impacts no change (low) |
Table 2. Direct damages of different types of disaster between 2000 and 2020, as recorded by EMDAT, and the attributable influence of climate change on each hazard (EMDAT 2019). Note that these values are likely to be substantial underestimates of the true magnitude of damages.
| Observed direct impacts | Attributable influence of climate change on hazard severity/likelihood (confidence level) | ||
|---|---|---|---|
| Hazard | Insured damages (USD) | Total damages (USD) | |
| Heatwaves | 10 000 | 13.4 bn | Increase (high) |
| Cold waves and severe winter conditions | 4.63 bn | 31.3 bn | Decrease (high) |
| Floods | 74.1 bn | 610 bn | Increase (medium) |
| Droughts | 21 bn | 119 bn | Increase (medium) |
| Wildfires | 51.3 bn | 94.3 bn | Increase (medium) |
| Storms | 499 bn | 1.30 trillion | Rainfall Increase (high) Other impacts no change (low) |
This is not a review of risk, because that is impossible without also discussing vulnerability and exposure to changing hazards. However, it provides a platform on which to begin such a discussion. Further, it is a basis for placing a price tag on the diverse impacts of climate change, with implications for mitigation and adaptation considerations at all levels of decision-making. It concludes with several key areas in which further work will improve upon quantification of climate-related impacts, and the applications of this to address the inequity at the heart of the climate crisis (Pelling and Garschagen 2019, Stone et al 2021, Raju et al 2022).
2. Climate change and extreme weather impacts
2.1. Heat
2.1.1. Changes in extremes
The most dramatic changes in extreme weather induced by climate change are in the rate and intensity of heat and cold extremes. The rate and intensity of cold extremes are declining while heat extremes are increasing, with dire consequences for communities around the world. By 2015, the chance of the most extreme daily maximum temperatures (above the 99.9th percentile) averaged over land had increased fivefold (Fischer and Knutti 2015). Globally, as a direct result of climate change, previously very rare heat is now just unusual (Donat et al 2016, King 2017, Dunn et al 2020, Seong et al 2021), while, in some cases, events now considered 'extreme' reach temperatures that were formerly all but impossible (Rahmstorf and Coumou 2011, Imada et al 2019, Sippel et al 2020, Robinson et al 2021). The 2021 IPCC report is unequivocal in stating that average and extreme heat are increasing on every continent and that this is due to human-caused climate change (Masson-Delmotte et al 2021):
- A heatwave that would once have had a chance of 1 in 10 to occur in any given year in the pre-industrial climate will now occur 2.8 (1.8–3.2) times more frequently and be 1.2 °C hotter. At 2 °C of global warming, it will occur 5.6 (3.8–6.0) times more frequently and be 2.6 °C hotter.
- A heatwave that would have had a 1 in 50 chance to occur in any given year in the pre-industrial climate will now occur 4.8 (2.3–6.4) times more frequently and be 1.2 °C hotter. At 2 °C of global warming, it will occur 13.9 (6.9–16.6) times more frequently and be 2.7 °C hotter.
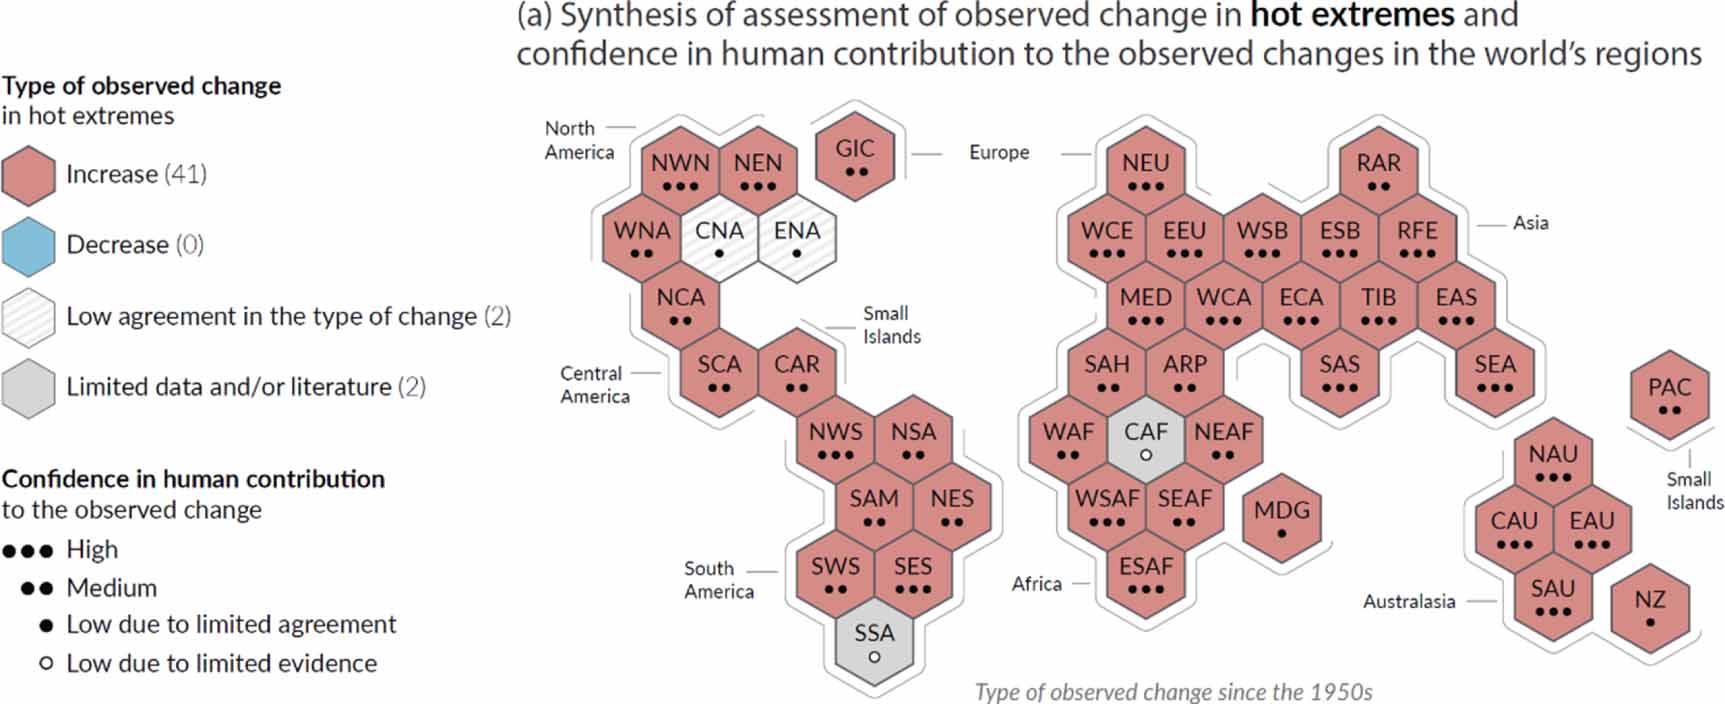
For even rarer events and on local scales the changes are even more dramatic. The increasing regularity of formerly rare events is particularly consequential: societies tend not to prepare for events that were historically so unlikely that they have never occurred (Woo 2016). Societies are especially vulnerable to the exceptionally extreme events that are now possible in a changing climate (Ciavarella et al 2021). In addition to this global picture, regional trends in heat extremes are attributed to climate change in Asia (Dong et al 2018, Yin et al 2019, Chen and Sun 2021), Africa (Stott et al 2011), Australia (Alexander and Arblaster 2017), Europe (Christidis and Stott 2016) and South America (Rusticucci and Zazulie 2021). A synthesis of current regional changes due to human influence are shown in figure 1. We reproduce this figure and others from Working Group 1 (WG1) contribution to the IPCC AR6 (Masson-Delmotte et al 2021) to give context for our discussion of where attribution can add value to these global and regional pictures.

Figure 1. Synthesis of assessment of observed change in hot extremes and confidence in human contribution to the observed changes in the AR6 land-regions, excluding Antarctica. The evidence is mostly drawn from changes in metrics based on daily maximum temperatures; regional studies using other indices (heatwave duration, frequency and intensity) are used in addition. From figure SPM.3 of the WG1 contribution to the IPCC AR6. See Masson-Delmotte et al (2021) for more details and Otto et al (2021) for the dataset.
Download figure:
Standard image High-resolution image2.1.2. Why it matters
The impact of increased temperatures on mortality is widely established in the epidemiological literature. As climate change intensifies heatwaves around the world, the risk of heat-related deaths increases unless exposed populations' vulnerability is reduced. The fraction of the burden of heat-related mortality that is due to climate change is large and growing, with 37% of heat-related deaths attributed to climate change worldwide (Vicedo-Cabrera et al 2021), equivalent to tens of thousands of deaths per year. Increases in the number of hot days, and intensity of heatwaves results in a range of heat-related illnesses. Such illnesses include cardiovascular and respiratory complications, renal failure, electrolyte imbalance, and harm to foetal health (Moyce et al 2016, Ebi et al 2018, Parsons et al 2021). Increasing temperatures and heatwaves have also increased the prevalence and range of temperature-sensitive pathogens, such as Vibrio, which can cause cholera and gastroenteritis (Ebi et al 2017).
Increases in the occurrence of heat extremes result in substantial increases in mortality, and this effect is particularly pronounced the higher the temperatures. Climate change increases the likelihood of reaching very high temperatures, at which point the human body may no longer be able to cool itself. The theoretical limit for human survival is a 'wet bulb' temperature of 35 °C, at which point even the healthiest human in shade and with water would die from severe heat stroke in a matter of hours (Raymond et al 2020). Both mortality and morbidity rise significantly at far lower temperatures than this upper limit, affecting the elderly, very young and those with pre-existing medical conditions, such as respiratory and cardiovascular illness (Michelozzi et al 2009, Sugg et al 2016, Watts et al 2018, Green et al 2019). Heatwaves are also strongly associated with rises in harmful pollutants such as ozone, particulate matter, sulphur dioxide, carbon monoxide and nitrogen dioxide, which further contribute to respiratory health impacts (Garcia-Herrera et al 2010, Analitis et al 2014, Li et al 2017, Kalisa et al 2018).
A direct consequence of the health impacts of heat is a loss of labour productivity during hot periods, as workers must slow down, take more breaks, and hydrate to remain safe (Sahu et al 2013, Kjellstrom et al 2016, Spector et al 2019, Borg et al 2021). In the US alone, labour productivity losses due to extreme heat cost around USD 2 bn annually (Zhang and Shindell 2021), while across the world total losses amount to USD 280–311 bn (Borg et al 2021). These are concentrated in lower- and middle-income countries, in tropical and subtropical areas, and in heavy manual labour and outdoor industries such as agriculture and construction (Kjellstrom et al 2016, Borg et al 2021, Parsons et al 2021). Across the world, the labour capacity of rural populations during summer months fell by 5.3% between 2000 and 2016 due to rising heat—in tropical regions capacity fell by up to 30% (Watts et al 2018). While some adaptation policies have already been put into place, such as moving work hours earlier in the day, these measures may come with unintended consequences, and decrease in effectiveness as warming continues (Masuda et al 2019, Parsons et al 2021).
While there have been very few observations of wet bulb temperatures over the critical 35 °C threshold, the occurrence of dangerous humid heat extremes, exceeding wet bulb temperatures of at least 27 °C, has more than doubled since 1979 (Raymond et al 2020). By another measure, 40% of the total land surface has already entered an 'unusual' climate in the warmest months—that is, temperatures exceed a signal-to-noise ratio of 1 (Frame et al 2017, Hawkins et al 2020). Increases in severe heat hazards cause a disproportionate increase in the associated health risks because a disproportionately large fraction of the global population lives in hotter regions (Watts et al 2018). On top of that, between 2000 and 2016, the number of vulnerable people (over 65 years) exposed to extreme heat increased by 125 million, reaching 175 million in 2015 (Watts et al 2018).
2.1.3. Attributable impacts
Climate change amplifies the temperature of most heat extremes (Otto et al 2016). Attribution research has found that the most extreme heatwaves have become substantially more likely, or even only possible at all (Imada et al 2019), due to climate change. This includes, but is not limited to, events in Europe in 2003 (Stott et al 2004, Christidis et al 2015) and 2018 (Leach et al 2020), Russia 2010 (Rahmstorf and Coumou 2011, Otto et al 2012), the US (Shiogama et al 2014), China (Sparrow et al 2018, Zhou et al 2019), Argentina (Hannart et al 2015), North Africa (Mitchell 2016), Australasia (Hope et al 2016), South and Southeast Asia (Azhar et al 2014, Wehner et al 2016, Mazdiyasni et al 2017, Imada et al 2018, Christidis et al 2018b), and across the world (Peterson et al 2012, 2015, Herring et al 2014, 2015, 2016, 2018, 2019, 2020). In some cases, events were effectively impossible in the absence of climate change (Herring et al 2019, 2020, 2021, Imada et al 2019, Fischer et al 2021, World Weather Attribution 2021a), including the emerging possibility of simultaneous heat extremes across regions and continents (Kornhuber et al 2019, Vogel et al 2019).
Between the years 2000 and 2020, the disaster database EMDAT recorded approximately 157 000 deaths from heatwaves across the planet (table 2, EMDAT 2019), although it is acknowledged that this is likely to be a substantial underestimate due to reporting limitations and because deaths due to heat occur outside of officially-declared events (Otto et al 2020a, see below). Around 125 000 of these deaths occurred during just two events, the European heatwave of 2003 and Russian heatwave of 2010, which resulted in 70 000 and 55 000 deaths, respectively. Both of these events were made substantially more likely by climate change, as noted above (Stott et al 2004, Rahmstorf and Coumou 2011, Otto et al 2012). In the case of the 2003 heatwave, this was made at least twice as likely to occur, due to climate change, and has since become 10 times more likely again (Christidis et al 2015). The Russian heatwave, meanwhile, was found to have been made 5 times more likely to occur by the climate change observed since 1960 (Rahmstorf and Coumou 2011). In the UK, estimates using simple hazard-based FAR methodology link around 1,500 excess deaths from three heatwaves directly to climate change (Clarke et al 2021). And another study on the 2003 heatwave used an end-to-end approach, combining meteorological attribution with the effect of temperatures on mortality, to directly attribute deaths in Greater London and Central Paris; 64 additional Londoners (∼20% of the total) and 506 Parisians (∼70% of the total) died due to the influence of climate change (Mitchell et al 2016).
2.1.3.1. CASE STUDY: Western Russia, 2010
From early July until mid-August 2010, an intense high-pressure system over Eastern Europe and Western Russia caused temperatures to soar above 30 °C throughout the region, breaking 40 °C in many major cities. An event of this magnitude was made approximately 3–5 times more likely by climate change (Rahmstorf and Coumou 2011, Otto et al 2012).
This extreme heat led to widespread drought conditions that decimated 25% of the entire annual crop yield and also amplified wildfires across more than 10 million hectares of dried-out forests, steppe and peat regions (Barriopedro et al 2011, Bondur 2011). This compounded an already growing fire hazard in rural Western Russia, resulting from changes in land use and sustainable management, among other factors (Goldammer 2010). The destruction of grain crops and subsequent export ban led to rising food prices domestically and abroad. Pakistan was Russia's fourth largest customer and experienced a 16% rise in the price of wheat, linked with a 1.6% rise in poverty (Welton 2010). The destruction of thousands of properties left over 3500 people homeless. Harmful gases and aerosols from the fires became trapped in the stagnant high-pressure system, resulting in poor air quality in many major cities. This exacerbated the already-unprecedented public health crisis, particularly affecting those with severe asthma and heart problems. In the city of Moscow alone, around 5000 more deaths were recorded than for the same period in the previous year, and across the whole country this was closer to 55 000 from a combination of heat and poor air quality (Barriopedro et al 2011).
2.1.4. Underestimation of impacts
These Europe-focused results are far from a complete tally of climate change-amplified heatwave impacts. This is largely due to data limitations. Both assessments of health associated with extreme heat (Green et al 2019) and weather observations, crucial for assessing the link to climate change (Otto et al 2020a), are concentrated within higher income countries. EMDAT lists 147 instances of impactful heat events from individual countries for the period 2000–2020, only an improbably low 58 of which are from all of Asia, Africa, South and Central America and the Caribbean combined (EMDAT 2019). Of the 157 000 total deaths recorded, only 10 000—or 6.3%—were recorded in these regions, which together constitute almost 85% of the world's population, over 60% of the land mass, and many of the hottest and most humid climates. These data are subject to recording biases that limit the number of heatwaves registered to EMDAT to those that are officially declared by national meteorological services, many of which do not currently have formal heatwave definitions, and recorded locally as exceeding one of several impact thresholds; thus, they are limited by the capacity of governments or NGOs to attribute heat-related impacts. Further, this dataset focuses only on heatwaves, periods of relatively extreme temperatures, whereas many heat-related deaths in fact occur outside of heatwaves, when temperatures are also increased by climate change, but are not captured within these data (Gasparrini et al 2015).
In the two most impactful European heatwaves recorded, the maximum recorded wet-bulb temperature peaked at 28 °C; temperatures frequently exceed this in other regions of the world such as south Asia (Raymond et al 2020), with many more lethal heat events likely already occurring than are reported (Mora et al 2017).
In addition to the attributable trends in exposure to extreme heat, we can elicit evidence from the few attribution studies that exist. For instance, in 2015 in the Indian city of Hyderabad, heat extremes over a 5 day period were made more than 30 times more likely by climate change (Wehner et al 2016). Including this event, three devastating heatwaves in India in 2010, 2013 and 2015 resulted in the deaths of at least 5000 people (Azhar et al 2014, Mazdiyasni et al 2017). Meanwhile in neighbouring Pakistan, also in 2015, the city of Karachi experienced an extreme heat event which by the same measure would have been effectively impossible without climate change (Wehner et al 2016).
The impacts from heatwaves in hotter climates may be somewhat mitigated by factors such as the natural acclimatisation of populations—which might also be considered as longer-term impacts upon behaviour, culture and architecture—and age demographics (Gasparrini et al 2015, Green et al 2019). However, these mitigating factors are more than likely offset by greater population density, higher frequency of more intense extremes, and greater vulnerability in many of the regions with few reported impacts (Harrington and Otto 2018, Rohat et al 2019). We are therefore confident that the reported deaths from heatwaves and extreme heat, and thus those linked to climate change, are a vast underestimate.
2.1.5. Is increased heatwave-related mortality offset by a reduction in cold extremes?
Cold extremes are decreasing in frequency and intensity across most of the world and at continental and subcontinental scales (Christidis and Stott 2016, King 2017, Dunn et al 2020, Hu et al 2020). In the Arctic, the rise in heat extremes (Sui et al 2017, Dobricic et al 2020) and decrease in cold extremes (Sui et al 2017) is especially pronounced, in line with its rapid warming (Box et al 2019). Specific cold spells of recent years have displayed this decreased probability due to climate change, including in the UK (Christidis and Stott 2020), US (Bellprat et al 2016), Europe (Peterson et al 2012, Christiansen et al 2018) and China (Sun et al 2018).
On average, mortality and morbidity rates are higher in winter than summer months in temperate regions (Conlon et al 2011, Ebi and Mills 2013, Gronlund et al 2018), with a more complex relationship in locations across the tropics and subtropics (McMichael et al 2008, Singh et al 2019). The direct effect of cold on health remains obscured by the wide array of seasonal factors at play (Staddon et al 2014, Kinney et al 2015, Hajat 2017), including cardiovascular disease which is only weakly linked to cold temperatures (Ebi and Mills 2013). For the effect of extremes specifically, there are two key factors to consider. First, temperature-mortality relationships are generally far steeper for extreme heat than extreme cold (Gronlund et al 2018). Second, the most severe winter cold spells contribute little to overall winter mortality, and even in some temperate regions there is evidence that climate change will not decrease winter mortality (Staddon et al 2014). Thus the reduction in frequency and intensity of cold extremes has likely not affected overall changes in mortality substantially, nor offset those from hot extremes (Ebi and Mills 2013) and the impact of increasing heat-related mortality are assessed to far exceed any reductions in cold-related mortality as a result of climate change (Gasparrini et al 2017, Huber et al 2017, Vicedo-Cabrera et al 2018).
2.2. Rainfall and flooding
2.2.1. Changes in high rainfall extremes
By 2015, climate change increased the likelihood of daily precipitation extremes exceeding the 99.9th percentile of pre-industrial events by 18%, averaged over all land regions (Fischer and Knutti 2015). A warmer atmosphere holds more moisture at a given pressure: the Clausius–Clapeyron relation states that the increase in moisture held at a given pressure is 6%–7% per 1 °C. Extra water in the atmosphere combines with changes in weather patterns to affect rainfall extremes in a given region (O'Gorman 2015, Pfahl et al 2017). In contrast to heat, these changes vary greatly across regions and seasons. For example, extreme rainfall is increasing in Northern Europe in winter but decreasing in the Southern part of the continent in summer.
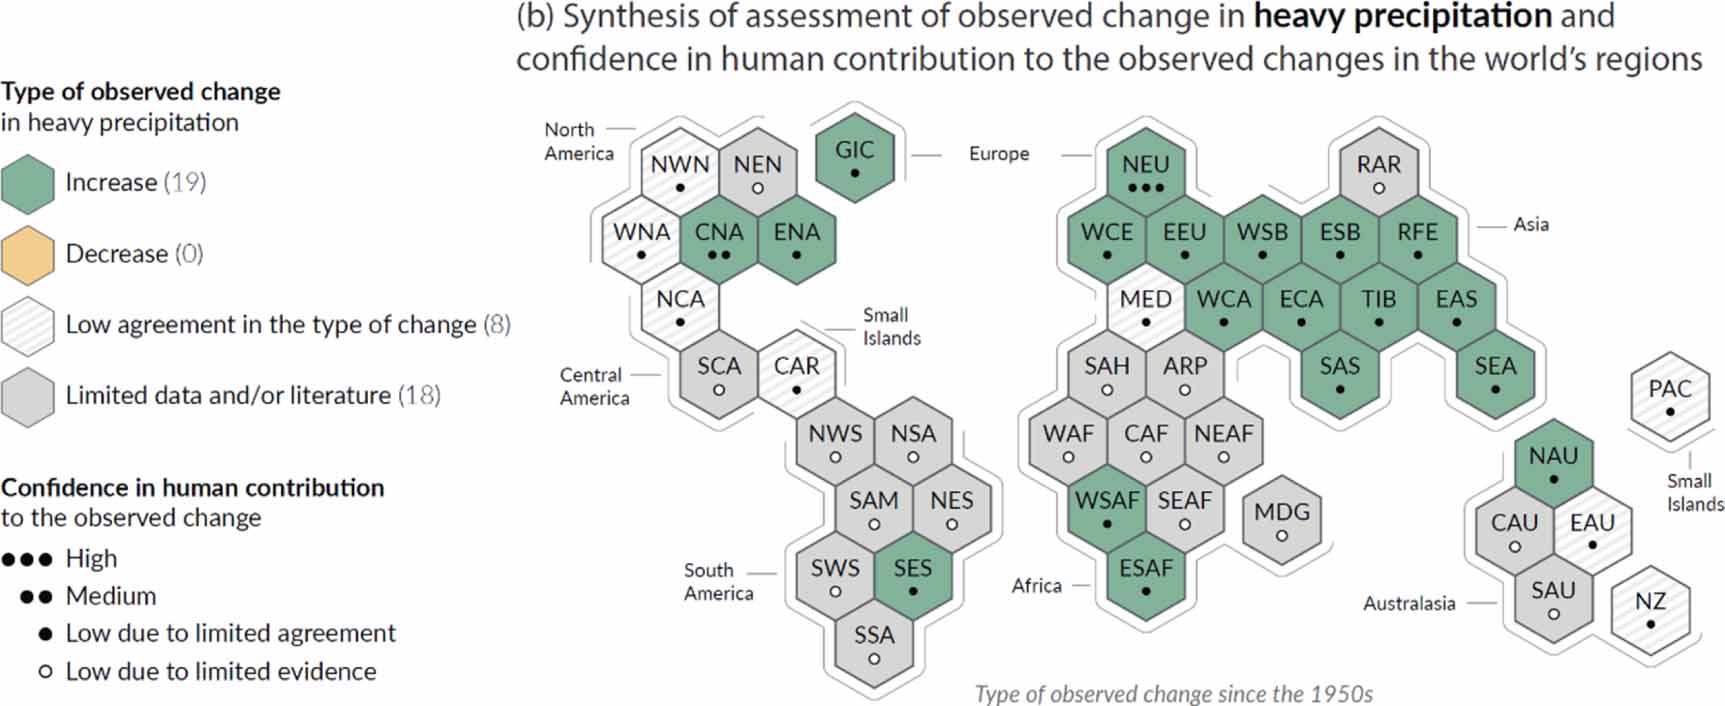
Nonetheless, since the 1950s, heavy rainfall has become more frequent and intense across most parts of the world, which is now known to be mainly due to human climate change (Fischer and Knutti 2015). It has not strongly decreased in likelihood anywhere. A synthesis of current regional changes due to human influence are shown in figure 2. Globally, the IPCC reports that, in a given location, what would once have been a one-in-10 year rainfall event currently occurs 1.3 (1.2–1.4) times every 10 years and is 6.7% wetter. At 2 °C of global warming, this will be 1.7 (1.6–2.0) times per 10 years and 14% wetter (Masson-Delmotte et al 2021). Sub-daily extreme rainfall events are intensifying at a rate at or exceeding Clausius–Clapeyron scaling (Fowler et al 2021), while regional attribution shows that deluges generally are becoming more frequent and intense especially across North America, Asia and Europe (Chen and Sun 2017a, 2021, Paik et al 2020, Dong et al 2021, Sun et al 2021), though this may also be true in other regions with a lower availability of observational data.

Figure 2. Synthesis of assessment of observed change in heavy precipitation and confidence in human contribution to the observed changes in the AR6 land-regions, excluding Antarctica. The evidence is mostly drawn from changes in indices based on one-day or five-day precipitation amounts using global and regional studies. From Figure SPM.3 of the WG1 contribution to the IPCC AR6. See Masson-Delmotte et al (2021) for more details and Otto et al (2021) for the dataset.
Download figure:
Standard image High-resolution image2.2.2. Link with flooding
Flooding is a major source of the impacts that extreme rainfall has upon human societies. In general, changes in the risk of flooding due to heavy precipitation also depend on changes in other factors including the susceptibility of areas to flooding, land use change and river management (Ji et al 2020), as well as other climate-related factors such as soil moisture, storm extent and snowmelt (Sharma et al 2018, Wasko and Nathan 2019). As a result, there is high regional and sub-regional variation in trends in streamflow (Do et al 2017, Gudmundsson et al 2019), but many of the observed changes can only be explained by human influence on the climate (Gudmundsson et al 2021). Evidence from attribution-science literature shows that growing numbers of floods have been made more intense by the effect of climate change on precipitation (Cho et al 2016, Pall et al 2017, van der Wiel et al 2017, Philip et al 2018a, Teufel et al 2019).
2.2.3. Why it matters
Flooding damages property and infrastructure, as evidenced by disaster data for the years 2000–2020 in which floods globally caused USD 610 bn in damage (table 2). It also places people in direct danger of injury and death. The flood events recorded in the EMDAT database led to 111 000 deaths and affected 1.66 bn people over the period 2000–2020 (table 1, EMDAT 2019). Indeed, flooding is the disaster that is recorded as affecting the greatest number of people—though this may be due to a bias arising from the variable ease of recording impacts for different disasters; heatwaves are more pervasive but ill-defined than flood extent, for example. One further study that considered only 'large floods' found that 255–290 million people were directly affected by flooding between 2000 and 2018, the population in areas affected by inundation grew by 58–86 million between 2000 and 2015, and the number of people affected by flooding continues to increase due to population increases and climate change (Tellman et al 2021).
Floods impact both physical and mental health. Physical impacts result directly from dangerous water flows and inundation, as well as 'cascading impacts', in which the destruction of infrastructure limits access to services and utilities including clean water and sanitation, resulting in ill health (Ramana Dhara et al 2013). In turn, this enhances the spread of and vulnerability to water-borne disease, including leptospirosis, cholera and other diarrhoeal diseases such as giardiasis, salmonellosis, and cryptosporidiosis (Marcheggiani et al 2010, Ramana Dhara et al 2013). This occurrence of such outbreaks following floods is well documented. This evidence includes an inventory of 87 extreme events between 1910 and 2010 (Cann et al 2013), known associations between flood events and gastrointestinal illness in the US (Patz et al 2008, Uejio et al 2014) and India (Bush et al 2014), and has been observed in the aftermath of floods in Pakistan (Baqir et al 2012), Mozambique (Devi 2019), China (Zhang et al 2019), Ecuador (Carlton et al 2014), the Solomon Islands (Jones et al 2016) and many others (Fredrick et al 2015, Levy et al 2016). This is especially impactful in areas of pre-existing high vulnerability, such as those without access to improved sanitation and water sources, on top of other poverty- and conflict-related factors such as access to healthcare, education and early warning systems (Cann et al 2013, Davies et al 2015).
In addition, vector-borne diseases such as malaria, dengue and West Nile Fever may spread further following flooding, as more widespread stagnant water bodies provide breeding grounds for mosquitoes (Ramana Dhara et al 2013, Hinz et al 2019). Finally, many diseases are also enhanced by the effect of warmth and high humidity, because this increases the longevity of many pathogens and mosquitoes (Moors et al 2013, Levy et al 2016, Hinz et al 2019). The combination of climate change impacts on precipitation, temperature, and yet other factors that amplify the resulting impacts, such as societal capacity to deal with health impacts, create compound risks.
Other compound risks are also associated with flooding. For example, low-lying coastal areas are increasingly affected by high sea levels, due to storm surges and sea-level rise, which combine with heavy rainfall to amplify flood damages (Moftakhari et al 2017, Bevacqua et al 2019, Marsooli and Lin 2020). Similarly, tropical cyclones result in damage to infrastructure including power lines, water supplies and roads, increasing vulnerability to high temperatures as air conditioning is disabled, and access to clean water and healthcare are restricted (Lin 2019; Matthews et al 2019, Mejia Manrique et al 2021, Yu et al 2020).
The mental health impacts of disasters are also becoming documented and understood more widely, with an emerging literature (Hayes et al 2018, Watts et al 2018, Cianconi et al 2020), especially on the impacts of floods (Tunstall et al 2006, Stanke et al 2012, Alderman et al 2013, Azuma et al 2014, Fernandez et al 2015, Burton et al 2016, Waite et al 2017). These impacts include post-traumatic stress disorder (PTSD), anxiety, depression and suicidal thoughts, among other conditions (Dodgen et al 2016) and persist long after the disaster itself. First responders are severely impacted by the mental health effects of working in the aftermath of disasters, with local first responders most heavily affected (Osofsky et al 2011, Rusiecki et al 2014). These effects are more likely to occur in those with pre-existing mental health conditions (Dodgen et al 2016, Hayes et al 2018). Quantitative attribution of mental health impacts to climate change remains challenging. This is due to the diverse nature of such impacts, and because attribution studies typically consider one aspect of the causal chain (climate-meteorological event or meteorological event-mental health impacts), not both (Hayes et al 2018). However, a few cases exist in which mental health impacts are attributed to an event and the event itself is attributed to climate change. For example, the 2013/14 UK floods were made more likely by climate change (Huntingford et al 2014, Christidis and Stott 2015, van Oldenborgh et al 2015, Schaller et al 2016, Kay et al 2018) and caused increased psychological morbidity among those both flooded and disrupted (Waite et al 2017).
2.2.4. Attributable impacts
Annual monsoons are a critical source of rainfall for at least 60% of the world's population in areas including south and east Asia, Australia, and east and west Africa (Li et al 2016). The south Asian monsoon is of particular societal importance, providing 80% of the water to the subcontinent, which contains nearly a fifth of the world's population and is heavily reliant upon agriculture (Katzenberger et al 2021). In the 20th Century, a decline in the East Asian summer monsoon rains was observed, with the most intense rains becoming shorter but more intense, including flooding and droughts (Burke and Stott 2017). Since 2000, the strength of south Asian monsoon rains has increased, with the most pronounced increases occurring in the most intense events (Katzenberger et al 2021). This pattern covers all monsoon regions, to varying degrees, and crucially an associated increase in both drought and flooding (Burke and Stott 2017, Wang et al 2021). In response to future warming, and if aerosol emissions are reduced, significant and substantial increases in monsoon rains are expected, resulting in growing flash flooding risks (Masson-Delmotte et al 2021), especially in East Asia (Samset et al 2018). However, as increased precipitation is expected to occur over fewer days of more intense rainfall, worsening of droughts also becomes more likely (Burke and Stott 2017).
According to EMDAT, around 49 000 deaths due to flooding occurred in south Asia from 2000 to 2020, almost half of recorded global flood mortality (EMDAT 2019). The region has also suffered damages of around USD 104 bn, only around USD 4 bn of which is recorded as insured damages. Many of the deadliest and most destructive floods in this subset occurred during the monsoon season, including in 2000 (India and Bangladesh), 2007 (across south Asia), 2010 (Pakistan), 2017 (Bangladesh), and 2005, 2008, 2013, 2019 and 2020 (India). However, even outside of the monsoon season, rainfall extremes have been amplified by climate change (Rimi et al 2018).
Outside of south Asia, the most impactful flood events in terms of both mortality and numbers of people affected by flooding also occurred primarily in low- and middle-income countries in Africa, including Sudan, Ethiopia, and Nigeria; South America, including Peru, Colombia and Brazil; and the Caribbean, including Haiti and the Dominican Republic. While few attribution assessments on specific events are available in these regions, there is nonetheless evidence of links between these types of events and climate change as described above. Further, trends in increased flooding have been identified in regions including parts of Brazil (Bartiko et al 2019) and Ethiopia (Mamo et al 2019), which combine with other factors to pose greater danger to people. For example, the Metropolitan Region of São Paulo has simultaneously undergone rapid urban expansion and an increase in the number of extremely heavy precipitation days. Such events were exceedingly rare in the 1950s, but by the 2010s occurred 2–5 times per year. This has placed people at a rapidly rising risk of flash flooding.
Not including tropical cyclones, extreme rainfall events with detected anthropogenic influence have occurred in Europe (Pall et al 2011, Schaller et al 2016, van Oldenborgh et al 2016, Otto et al 2018a), the Mediterranean (Vautard et al 2015), US (Herring et al 2014, Eden et al 2016, van der Wiel et al 2017), parts of South America (De Abreu et al 2018, Christidis et al 2018a), New Zealand (Rosier et al 2015), southeast Asia (Yun et al 2020), Japan (Imada et al 2020, Kawase et al 2020) and China (Burke et al 2016, Sun and Miao 2018, Zhou et al 2018, Yuan et al 2018b). Collectively, these events represent financial losses and destruction of property of more than USD 60 bn.
In certain areas, attribution studies on rainfall have directly estimated the fraction of damages incurred due to climate change. For example, in the UK between 2000 and 2020 approximately USD 9 bn in flood damages have been attributed to climate change (Clarke et al 2021). In New Zealand, USD 140 million in insured damages attributable to climate change occurred over 2007–2017, although this is likely a significant underestimate of overall costs (Frame et al 2020a). These studies provide broad estimates using a simple hazard-based FAR methodology. End-to-end attribution using hydrological models and taking account of exposure and vulnerability remains challenging (Schaller et al 2016), though research using modelling chains (Kay et al 2018) and a storyline approach (Schaller et al 2020) is ongoing. While changing weather patterns can be complex in a given area, the general trend is increasingly extreme rainfall resulting in destructive flooding over a large portion of the world's surface.
2.3. Drought
2.3.1. Changes in extremes
Droughts are complex but extremely impactful events that affect billions of people worldwide (table 1). There are many different types of drought with varying impacts. The main categories include meteorological, agricultural and hydrological drought. All are connected, and each simply refers to an anomalous moisture deficit in part of the hydrological system relative to some baseline, be it in precipitation, soil moisture, or groundwater reservoirs, respectively (Cook et al 2018). The fingerprint of climate change on increasing drought has been observed in several drought-prone regions of the world, including California, the Pacific Northwest, parts of China, western North America, and the Mediterranean (Gudmundsson and Seneviratne 2016, Chen and Sun 2017b, Cook et al 2018), as well as globally (Marvel et al 2019). With the exception of the Mediterranean, which is already receiving markedly less precipitation, this is largely due to amplified temperatures driving evaporation and melting snowpack, reducing the meltwater contribution to river flows (Cook et al 2018). Other smaller Mediterranean-like regions such as central Chile, the far southwest tip of southern Africa and southwest Australia have also dried due to climate change, and are now more prone to drought (Seager et al 2019). A synthesis of current regional changes due to human influence are shown in figure 3.

Figure 3. Synthesis of assessment of observed change in agricultural and ecological drought and confidence in human contribution to the observed changes in the AR6 land-regions, excluding Antarctica. These are assessed based on observed and simulated changes in total column soil moisture, complemented by evidence on changes in surface soil moisture, water balance (precipitation minus evapotranspiration) and indices driven by precipitation and atmospheric evaporative demand. From Figure SPM.3 of the WG1 contribution to the IPCC AR6. See Masson-Delmotte et al (2021) for more details and Otto et al (2021) for the dataset.
Download figure:
Standard image High-resolution image'Flash droughts' are a type of soil moisture, or agricultural, drought that occurs extremely rapidly, with little warning (Yuan et al 2019) and can have severe consequences for agricultural productivity. In recent years, there has been a notable rise in such events in the US, China and South Africa (Cook et al 2018). Meanwhile, some of the most catastrophic droughts in the world continue to occur in East Africa (Gebremeskel et al 2019). No single drought there has been linked directly to climate change, partly due to a relatively short observational record, high uncertainties and high natural variability, especially for precipitation (Uhe et al 2018, Philip et al 2018b, Kew et al 2021). There is limited evidence that anthropogenic warming of Western Pacific sea surface temperatures may contribute to more frequent drought (Funk 2012, Funk et al 2019). More generally, the drying of the major rainy season in the region, the 'long rains' (Lyon and Dewitt 2012), is likely connected to climate change (Tierney et al 2015, Hoell et al 2017).
2.3.2. Why it matters
In 2019, there were approximately 690 million undernourished people. Food insecurity is linked to conflict, alongside climate-related shocks such as drought (FAO 2020). The least food secure regions of the world are the most vulnerable to drought, and thus any increase in drought severity due to climate change. In Brazil, an ongoing drought since 2019 has led to water scarcity, severe crop losses including corn and coffee, and amplified fire activity in the Amazon (Marengo et al 2021). In south Asia, the changing patterns of monsoon rainfall as well as rising temperatures and other types of extreme weather have already caused a decline in food security (Bandara and Cai 2014). In East Africa, the major drought in 1984/85 led to a famine that caused the deaths of around 450 000 people. More recently, a drought in 2008–10 affected 13 million people, another in 2010–11 affected 12 million and caused the deaths of 250 000 people in Somalia alone. Since 2005, droughts have increased in frequency in East Africa and caused substantial livestock death, disruption of livelihoods and rising food prices (Nicholson 2017, Gebremeskel et al 2019). In turn, this has contributed to internal migration and further socio-economic instabilities in the region (Gebremeskel et al 2019). From South Asia across the middle east and most of Africa, hunger is a growing challenge that drought is exacerbating. More broadly, extension of drought across water-scarce regions is exceptionally costly through its impact on ecosystems, agriculture and wider society (Cook et al 2018).
2.3.3. Attributable impacts
The fingerprint of climate change has manifested very clearly on several recent droughts. California provides an exemplary case. From 2011 to 2017, it suffered an extended drought, possibly the worst in a thousand years (Osaka and Bellamy 2020). Even as this event unfolded, scientists demonstrated that various contributing factors were attributable to climate change, including reduced snowpack (Mote et al 2016, Berg and Hall 2017) and warm dry years (Diffenbaugh et al 2015, Williams et al 2015). This drought was then alleviated by incredibly intense seasonal rainfall that led to destructive flooding, with damages of at least USD 1 bn (The Weather Channel 2017), in a compound event that has been linked to climate change (Simon Wang et al 2017). Similar compound droughts and floods have occurred in the UK (Parry et al 2013) and East Africa (Gebremeskel et al 2019). Not only that, new research shows that the California drought was a smaller part of a larger mega-drought stretching from 2000 to 2018, which itself was pushed from a moderate event to the worst in 1200 years by climate change (Williams et al 2020). From 2014 to 2016, economic losses in the agriculture industry amounted to at least USD 5.5 bn, and the loss of 42 000 jobs (Howitt et al 2014, 2015, Medellín-Azuara et al 2016). Furthermore, during the first three years of the drought, hundreds of millions of trees perished due to water stress, wildfires and proliferating bark beetles; in parts of the Sierra Nevada almost half of all trees died (Fettig et al 2019).
There are several other cases of drought across the world that have been shown to have been intensified by climate change. This includes South Africa 2015–17 (Yuan et al 2018a, Otto et al 2018b), Europe 2016–17 (García-Herrera et al 2019), Indonesia 2015 (King et al 2016), New Zealand (Harrington et al 2016) and Canada (Szeto et al 2016).
The impacts of these droughts vary greatly in severity and form, being acutely related to exposure and vulnerability in the affected region. In Canada, drought conditions led to forest fires that created a serious public health risk. In New Zealand, economic costs of the 2013 drought totalled at least USD 1.3 bn. In Europe, drought costs an average of €6.8 bn per year (García-Herrera et al 2019). Against this backdrop, the extreme 2016–17 event caused loss of many types of crops, including cereals, olives, tomatoes, wine grapes, and almonds, with losses of at least €2 bn in Italy alone (García-Herrera et al 2019). Episodic drought is becoming more common in Brazil, and though the number of fatalities has fallen drastically, the number of people affected is still increasing; since 1990, hundreds of droughts affected over a billion people (Sena et al 2014). In South Africa, economic losses totalled USD 400 million, cost tens of thousands of jobs and months of extreme water restrictions for citizens in late 2017 (Stanford University 2020). Cape Town also narrowly avoided 'day zero', when there would have been no water remaining in city pipes. Attribution research has demonstrated that climate change amplified all of these impacts.
2.3.3.1. CASE STUDY: Indonesia, 2015
In the dry season of July–October 2015, Indonesia experienced a combination of severe heat and extremely low precipitation that created drought conditions. This was partly due to the occurrence of a strong El Niño, which is linked to high temperatures and strongly linked to lower-than-normal precipitation rates in the dry season in Indonesia. In addition, the resulting land surface temperatures were also amplified significantly by anthropogenic warming (King et al 2016).
The impacts of this drought were myriad and severe. Farmland drought affected over 111 000 hectares of crops (DMCDD 2015 ), which led to widespread loss of income, rises in food prices (Webb and Wadhwa 2016 ) and poverty (Reuters 2015 ). It triggered the worst fire season since 1997, resulting in air pollution that detrimentally affected the health of millions and caused in the deaths of over 100 300 people across Indonesia, Malaysia and Singapore (Huijnen et al 2016, Koplitz et al 2016 ). The impact on vegetation more widely disrupted local wildlife, causing thousands of long-tailed monkeys to attack and steal from villages in search of food (Rohmah 2015).
2.4. Wildfire
2.4.1. Changes in extremes
Wildfire risk is inextricably tied to dry and hot conditions, and is greatest during periods of 'Fire weather', classified using various metrics as some combination of high temperature, low humidity, lack of rain, fuel availability and high wind speed (Van Wagner 1987, Dowdy et al 2009). The risk of wildfire has already substantially increased in many regions, including the western US, Alaska and Canada (Jarraud and Steiner 2012, Dennison et al 2014, Balch et al 2018, Goss et al 2020), the Mediterranean (Abatzoglou et al 2019, Barbero et al 2020, Touma et al 2021), Amazonia (Alencar et al 2011, 2015, Abatzoglou et al 2019, Touma et al 2021), southeast Asia (Touma et al 2021) and Australia (Dowdy 2018, Dowdy and Pepler 2018, Harris and Lucas 2019). A synthesis of current regional changes due to human influence are shown in figure 4.

Figure 4. Synthesis of observed, attributed and projected changes in fire weather, from the Interactive Atlas of WG1 of the AR6 of the IPCC (Gutiérrez et al 2021, Iturbide et al 2021, Masson-Delmotte et al 2021).
Download figure:
Standard image High-resolution image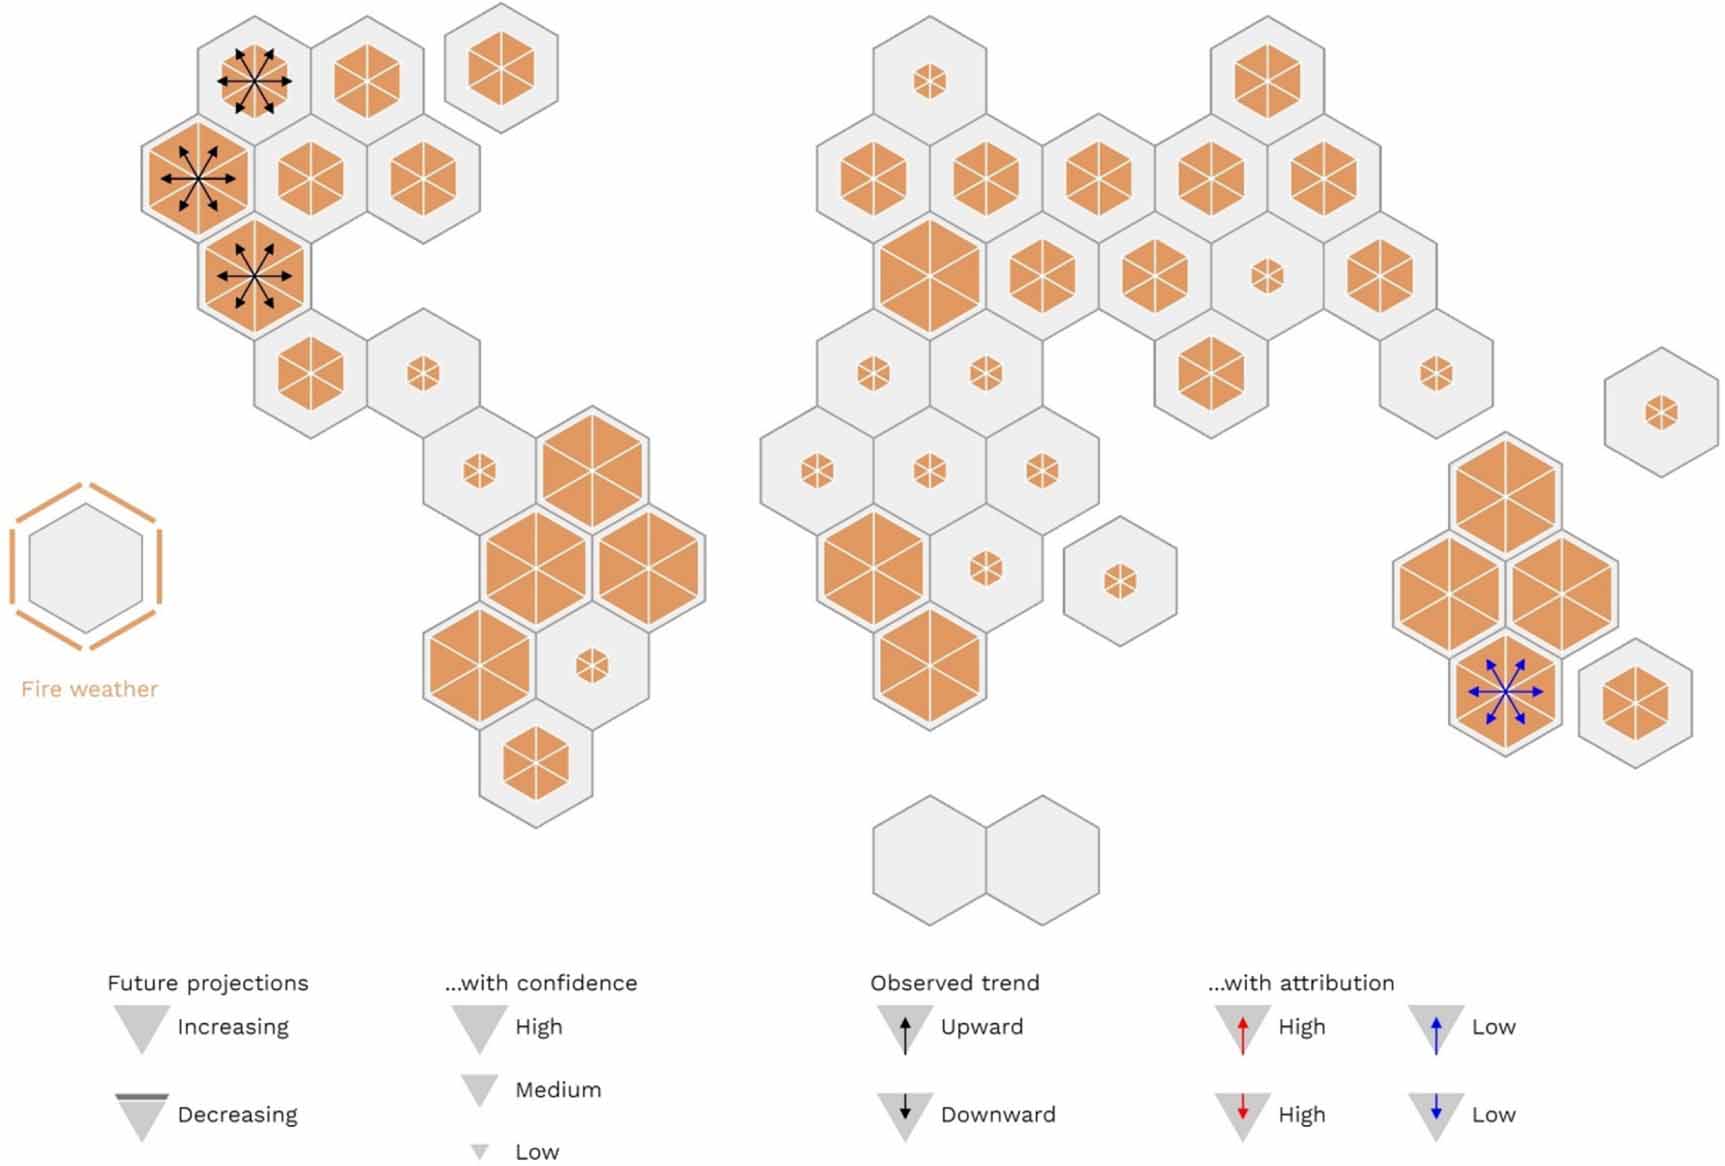
Recent blazes across the world have proved to be violent manifestations of this. For instance, in British Columbia in 2017 and 2021 severe hot and dry summers led to unprecedented forest fires. In 2017, the burned area was made 7–11 times larger by climate change and, equivalently, the event was made 2–4 times more likely (Kirchmeier‐Young et al 2019). Similar results were found in an analysis of fire risk in Western Canada, where fires as large as those that burned almost 600 000 ha near Fort McMurray, Alberta, in 2016, were found to have become 1.5–6 times more likely to occur as a result of climate change (Kirchmeier-Young et al 2017). In Sweden in 2018, extensive forest fires were made 10% more likely by climate change (Krikken et al 2019). And using the same method, the record-breaking Australian bushfire season of 2019/20 was made at least 30% more likely by climate change (van Oldenborgh et al 2020). From 1984 to 2015, over 4 million ha of burned area in the western US is directly attributed to climate change (Abatzoglou and Williams 2016). And in southern China, extreme wildfires of 2019 were made over seven times more likely by climate change (Du et al 2021).
2.4.2. Why it matters
Wildfires can cause direct mortality, although the total number of direct deaths are typically lower than for other extreme events (table 1). However, wildfire smoke consists of fine particulate matter (known as PM2.5 and PM10) that reaches deep into the lungs when inhaled, can reach the bloodstream, and is likely more toxic than ambient particulates of the same scale (Aguilera et al 2021). The hazardous air pollutants that constitute the smoke aggravate existing respiratory health issues, trigger new conditions and may also have links to cardiovascular health impacts (Reid et al 2016, Matz et al 2020, Chen et al 2021), as well as adverse effects on pregnancy outcomes (Abdo et al 2019). In Canada, short term effects of wildfire smoke include 54–240 premature deaths and USD 0.41–1.8 bn annually, while long-term chronic issues are responsible for 570–2500 premature deaths and costs of USD 4.3–19 bn annually (Matz et al 2020). A similar study for the US from 2008 to 2012 showed that short-term effects cost thousands of lives and additional hospital admissions for respiratory and cardiovascular illness annually, while long-term exposure cost tens of thousands of lives annually—the economic costs of these health burdens was estimated as USD 11–20 bn (2010$) per year for short-term, and USD 76–130 bn per year for long-term effects (Fann et al 2018). Finally, across the world total attributable deaths to landscape fire smoke are in the hundreds of thousands (262 000 in La Niña years, compared with 532 000 during El Niño), with the worst affected areas being sub-Saharan Africa and southeast Asia (Johnston et al 2012).
2.4.3. Attributable impacts
Severe impacts have also been recorded for attributed weather and fire events. For instance, during the anthropogenically amplified European heatwave of 2003, the central and Algarve regions of Portugal experienced the worst mega-fires in history (Tedim et al 2013). The resultant smoke dispersed across Europe, increasing the concentrations of PM2.5 by 20%–200% in many places (Hodzic et al 2007), where several hundred deaths were linked to air pollution in the UK and Netherlands alone (Solberg et al 2008). Fires across Indonesia in 2015 led to over 100 000 excess deaths. Similarly, in Russia in 2010 smoke from burning forests and peatlands became trapped over population centres, exacerbating the public health crisis and causing up to 2000 excess deaths in Moscow alone (Shaposhnikov et al 2014). The Black Saturday bushfires in Victoria, Australia in 2009 were made more likely by climate change (Black 2016), and resulted in PTSD in a significant minority of the most affected groups (Bryant et al 2014). Finally, the 2016 Alberta wildfires displaced over 80 000 people and caused over CAD 3.5 bn in insured losses. As noted above, these fires were made substantially more likely due to climate change. Across Canada, wildfires burn 2.1 million ha per year, approximately the area of Wales (Kirchmeier-Young et al 2017).
2.4.3.1. CASE STUDY: Australia, 2019/20
In the summer of 2019/20, New South Wales experienced the worst fire season on record, since dubbed the 'Black Summer fires'. In the 2019 fire year, the burned area totalled almost three times that in any of the previous 32 years (Canadell et al 2021). This event was made at least 30% more likely by climate change (van Oldenborgh et al 2020), which adds further evidence that dangerous fire weather in southeast Australia has emerged outside of the range of historical experience (Abram et al 2021). Not only that, the sheer scale of the fires went beyond anything either simulated in CMIP6 models or widely discussed even within the large uncertainties associated with wildfire hazards;this led to calls for urgent improvement of both risk modelling and uncertainty interpretation for accurately informing society of such unprecedented risks going forwards (Sanderson and Fisher 2020). This case study thus illustrates a broader point about the urgent need to provide risk guidance acknowledging both known and unknown unknowns, especially in a changing climate (Sanderson and Fisher 2020, Clarke et al 2021).
These fires burned a record 19 million hectares of forest and woodland (Khan 2021), resulting in the direct destruction of 5900 buildings and tens of thousands of livestock being killed. An estimated 3 bn mammals, reptiles, birds and frogs were killed or displaced, making it 'one of the worst wildlife disasters in modern history.' (WWF Australia 2020), with fears of possible extinctions of endangered species (Filkov et al 2020, Ward et al 2020).
Across the region, levels of PM2.5 exceeded the WHO guideline levels fourfold (Yu et al 2020). Smoke from the fires was responsible for '417 excess deaths, 1124 hospitalisations for cardiovascular problems and 2027 for respiratory problems, and 1305 presentations to emergency departments with asthma' (Borchers Arriagada et al 2020, Filkov et al 2020). The costs associated with this totalled AUD 1.95 bn, approximately 10 times the annual health burden due to fire smoke (Johnston et al 2021).
2.5. Tropical cyclones
2.5.1. Changes in extremes
Trends indicate no significant change in the frequency of tropical cyclones globally, but a greater fraction of those that do occur are the most intense Saffir-Simpson category 4 and 5 superstorms (Walsh et al 2019, Kossin et al 2020), which usually dominate the societal impacts (Christensen et al 2013). Tropical cyclones are also shifting poleward in most regions, affecting the areas impacted (Kossin et al 2016). Further, a slowing in tropical cyclone movement has been observed (Kossin 2018, Yamaguchi and Maeda 2020), accompanied by deposition of higher rainfall intensities (Patricola and Wehner 2018), affecting the severity of impacts.
There is substantial variability between basins. Increasing trends in the number of storms are most significant in the central Pacific, Arabia Sea and North Atlantic, and decreases are observed in the Bay of Bengal, the southern Indian Ocean and western North Pacific. This spatial distribution change is too large to be explained by natural variability alone and is linked to climate change (Murakami et al 2020). In the North Atlantic, an observed increase in intensification rate is likely too large for natural variability (Bhatia et al 2019), likewise for the significant slowing of translation speed over the US (Kossin 2018), while the observed increase in overall activity is significant yet not attributable to climate change (Ting et al 2015). In the Bay of Bengal, despite the decreasing numbers, there is a clear increasing trend in the fraction of high intensity storms and overall cyclone energy (Balaji et al 2018). Changes in overall activity are less certain in the west Pacific due to high variability, but northward shift in storm tracks since the 1980s is significant (Kossin et al 2016, Lee et al 2020), as is a slowdown of translation speed (Yamaguchi and Maeda 2020).
There have also been several notable events amplified by climate change in recent years, including Hurricanes Irma, Maria, Katrina, Harvey, Florence, Sandy, Typhoons Haiyan and Morakot, and others. Additionally, notable recent seasons of high cyclone activity could not be explained without anthropogenic influence, including in the Arabian sea in 2015 (Murakami et al 2017), in the western North Pacific in 2015 (Zhang et al 2016, Yang et al 2018, Yamada et al 2019), and in the North Atlantic in 2017 (Murakami et al 2018).
2.5.2. Why it matters
Tropical cyclones often cause flooding, including due to storm surges affecting coastal areas. In addition, storms generate high winds that fell trees, and destroy property and power lines, thus creating further disruption. For instance, in the wake of Hurricane Irma in 2017, services on Puerto Rico were hindered by blackouts after a partial collapse of the power system (Zorrilla 2017). When Hurricane Maria struck just two weeks later it caused devastation exacerbated by this additional vulnerability. Further, it extended the spatial and temporal aspects of disruption to services and the power grid across the island and for months into the future (Kishore et al 2018, Kwasinski et al 2019). The subsequent reliance on generators led to worsening air quality in San Juan (Subramanian et al 2018). The extreme rainfall also triggered over 40 000 landslides across the island, wiping out other power lines, roads and other structures (Bessette-Kirton et al 2019). The storm's passage also severely damaged vegetation across the island, which took months to fully recover (Hu and Smith 2018). There were also more long-term impacts. For example, in 2017 in Puerto Rico, in the context of an already-struggling economy, the severity of the 2017 hurricane season may have led between 129 000 and 477 000 Puerto Ricans to migrate away from the island (Acosta et al 2020).
2.5.3. Attributable impacts
Rainfall from Hurricanes Katrina, Maria and Irma was amplified by climate change (Patricola and Wehner 2018). In Puerto Rico, Maria and Irma resulted in widespread anxiety-mood disorders (Ferré et al 2019, Galea et al 2007, Scaramutti et al 2019, Whaley 2009), as in Hurricane Katrina (Galea et al 2007, Whaley 2009), especially prevalent among the most marginalised groups (Rhodes et al 2010) and the young (Orengo-Aguayo et al 2019). Additionally, at least 1000, and potentially as many as 4645, people died (Kishore et al 2018, Santos-Burgoa et al 2018). We note an illustrative pair of case studies is provided by the relative impacts of Hurricane Maria in Puerto Rico and Hurricane Irma in Cuba; both islands experienced devastating landfall which caused mass destruction of property and infrastructure that affected the entire population. However, in Cuba the loss of life was far lower and the recovery was much swifter, which in turn reduced longer-term impacts. This is due to an array of factors, including engaging the public in disaster preparation and incorporating science into risk planning (Zakrison et al 2020), which are crucial to consider in any direct end-to-end attribution of impacts.
Other high-mortality tropical cyclones include Typhoon Haiyan (Lagmay et al 2015) and Cyclone Idai (Devi 2019), which are estimated to have led to over 7000 and 1300 deaths in southeast Asia and across south-eastern Africa, respectively. Typhoon Haiyan was shown to have been strengthened by climate change, increasing the height of the resulting storm surge by 20% (Takayabu et al 2015). During Cyclone Idai, flooding destroyed over 800 000 hectares of croplands belonging to half a million households (Club of Mozambique, 2019). In the Philippines, Haiyan severely impacted the livelihoods of 3.4 million coconut farmers and thus disrupted a major component of the nation's agriculture industry (Seriño et al 2021). The deadliest cyclone in the global record in the 21st Century, representing nearly 70% of all recorded mortality for storms in the period, was Cyclone Nargis, which struck Myanmar in 2008 and caused over 138 000 fatalities (Fritz et al 2009). This cyclone formed due to anomalously warm waters in the Bay of Bengal (Lin et al 2009), where such storms are becoming less frequent but more intense due to climate change (Balaji et al 2018).
In early 2022 in Malawi, Mozambique and Madagascar, tropical cyclones Ana and Batsirai triggered widespread flooding after causing extreme rainfall in the midst of a heavy rainy season. This led to a range of impacts, including destruction of thousands of homes and classrooms, as well as water supply systems, crops, roads, bridges, healthcare facilities and churches, and overall affecting hundreds of thousands of people. Rainfall from each was amplified by climate change, and the impacts were further compounded by high exposure and ongoing vulnerabilities in the region, including from recent flooding, conflict in northern Mozambique, and severe food insecurity in Madagascar (Otto et al 2022).
The extreme rainfall from Hurricanes Katrina, Irma, Maria, Harvey, Dorian, and Florence and Typhoon Morakot were each individually amplified by climate change (Van Oldenborgh et al 2017, Patricola and Wehner 2018, Wang et al 2018, 2019, Reed et al 2020, 2021, Frame et al 2020b). Furthermore, analysis of specific drivers of Hurricane Harvey showed that such an event was linked with anomalously high ocean temperatures (both in the Gulf of Mexico and globally), therefore suggesting direct causality to global warming (Trenberth et al 2018). Together, the six storms listed above caused almost half a trillion dollars in damage to property and infrastructure.
In the North Atlantic basin alone, it is likely that other hurricanes constituting damages in excess of USD 200 bn follow a similar pattern (EMDAT 2019). Furthermore, while Hurricane Sandy was not significantly intensified by climate change (Lackmann 2015), the probability of storm surges as high have more than tripled due to sea level rise (Lin et al 2016). The added effect of climate change on this storm surge resulted in an extra USD 8 bn in damage and affected a further 71 000 people (Strauss et al 2021). It is reasonable to conclude that both storm surge and rainfall totals from all tropical cyclones are being amplified by climate change, while other aspects of such events vary between basins.
3. Discussion and conclusions
Developments in climate change attribution, improved understanding of the myriad impacts of extreme weather, and documenting its harms, have meant that an increasingly diverse and societally-relevant range of impacts can be assessed for their connection to anthropogenic climate change. This includes those occurring on local and regional scales beyond those assessed in the recent IPCC AR6.
However, both the impacts of climate change and the current degree of understanding of these vary across hazards and regions. In order to adapt to changing risks effectively, and to optimise mitigation of further warming, it is crucial that understanding continues to develop and does so equitably. This review and other work (Otto et al 2020b, Clarke et al 2021) provides a starting point for more systematic documenting of the costs (monetary and non-monetary) of human-caused climate change today and the losses and damages caused. In order to build on this, there are three areas in which scientific developments will add great value.
First, recording the impacts of extreme weather far more systematically around the world. A lack of data on past impacts of extreme events is a major barrier to mitigating future damages, simply because there is no direct evidence upon which to base the necessary measures. In particular, the impacts of extreme heat are chronically under-recorded in the global south. As explored by Harrington and Otto (2020) for heat in sub-Saharan Africa, this is likely due to institutional differences in the way impacts are recorded (government agencies vs NGOs), and would benefit from a collaborative effort to create databases for documenting mortality, morbidity and impacts on transport and power infrastructure, especially in cities. Furthermore, developing official heatwave definitions for nations currently lacking them would improve the chance that they are recorded in international disaster databases such as EMDAT.
Second, improve the coverage of attribution for more regions around the world, for a more diverse range of hazards, and with a focus on event definitions that are most pertinent to the impacts upon people. Attribution allows us to identify whether and to what degree climate change influenced a given event, as well as a trajectory of change over time. This is just part of the full picture of risk, as explored below. However, it remains useful to link between lived impacts and global climate change for the purposes of communication, adaptation and mitigation. It is therefore important everywhere.
Attribution studies on individual events are currently lacking for a number of regions and hazards. This includes key flood events highlighted earlier in this review as some of the most impactful, in South Asia; in Africa, including Sudan, Ethiopia, and Nigeria; in South America, including Peru, Colombia and Brazil; and the Caribbean, including Haiti and the Dominican Republic. Attribution of extreme heat is limited across South America and Africa largely due to a lack of research capacity across the world. For tropical cyclones, while rainfall and storm surge heights are increasingly well understood, especially in the North Atlantic, changes in intensity are not. Further, basins with some of the most devastating storms of the past, such as Cyclone Nargis in the Bay of Bengal and Cyclone Idai in the southwestern Indian Ocean, remain understudied. Finally, for wildfires, the IPCC AR6 documents regional observed changes. However, these are large spatial averages that may dampen the signal of individual attribution studies if they only apply to smaller subregions. Further, additional attribution work would add value in vulnerable and drought-prone regions such as Amazonia, the Mediterranean and Southern Africa.
Going forwards, the coverage of attribution studies can be improved in several ways: operationalising attribution and recording impact information as part of national weather services; incorporating local experts into any attribution analysis; building capacity for local experts to conduct such analyses in the future; improving understanding of compound event attribution, especially for drought; utilising the existing body of attribution literature to make statements without requiring new analysis in regions that are already well understood; creating a standardised language for impacts and risk.
The third and final area for future work involves a broader consideration of risk, rather than simply hazards and impacts. The context of a disaster, in the form of the exposure and vulnerability of affected individuals, infrastructure, agricultural systems and property, is crucial to a more complete understanding, whether this is included in quantitative analysis (e.g. Otto et al 2015, Ebi et al 2017), or provides a way to frame a study and define an event that is suitable for a particular use (Stone et al 2021). For instance, East Africa is frequently subjected to droughts with devastating humanitarian consequences. Despite substantial research into these events, no significant connection to climate change is detectable. In part, this is due to a dearth of observational data. However, the reality in the region is that high levels of vulnerability due to poverty and socio-cultural factors, and very high regional exposure are already significant drivers of disasters.
One consequence of this is that even a relatively small climate change signal would lead to vastly-amplified impacts in the region—this framing tells part of the story. Most importantly, however, it also shows that to reduce risks it is more pertinent to tackle these non-climate drivers head-on, rather than blaming the external forces of 'nature' or 'climate' (Raju et al 2022).
Therefore, in the illustrative case of East Africa, expending additional resources purely to identify a climate-related signal from the noise is relatively unimportant, and headlines about climate change driving drought in the region are actively unhelpful. Instead, in order to mitigate impacts, the focus of research and resources ought to be the development of reliable seasonal forecasting, the effective distribution of this information, and other measures to reduce vulnerability (Coughlan de Perez et al 2019, Gebremeskel et al 2019). In this situation, attribution provides a crucial source of information if it is framed in such a way to identify all key drivers of impacts, not simply answering the climate question or considering meteorological extremes (Stone et al 2021, Raju et al 2022).
A recent study on famine in Madagascar exemplifies this approach (World Weather Attribution 2021b). Analysis found that low precipitation totals, which contributed to the crisis, were not significantly changed in likelihood by human-caused climate change. Instead, the main drivers of the famine were food insecurity due to poverty, compounded by outbreaks of pests and COVID-19 restrictions. This information has great utility for risk reduction, which promises significant near-term co-benefits yet may be overlooked in analysis focused solely on climate change. Building on this, the study also notes an emerging future connection to climate change, which will likely only amplify such droughts significantly at global warming levels of greater than 2 °C. This could be important information for mitigation going forwards.
This work is in line with other analyses in which climate change is found to be the single most important driver of an event. For example, in Siberia in 2020, the extreme heat would have been all but impossible without human-caused climate change (World Weather Attribution 2021c). In essence, to address climate change appropriately, it is important to understand all of the key drivers of an event that may be hidden behind the headlines—neither ignoring climate change nor focusing solely upon it.
Acknowledgments
This work was supported by a NERC Doctoral Training Partnership Grant NE/L002612/1 and the European Union's Horizon 2020 research and innovation program under Grant Agreement No. 101003469. R F S-S acknowledges support from the Natural Environment Research Council Grant NE/S007474/1, Climate Analytics and the Oxford Martin Programme on the Post-Carbon Transition. L J H acknowledges funding from the New Zealand MBIE Endeavour Fund Whakahura programme (Grant ID: RTVU1906). This work was also supported by the Austrian non-profit organisation AllRise (Reg. No. 1958321055). These funding bodies had no direct involvement in the conduct of the research or production of the article.
Data availability statement
The data that support the findings of this study are available upon reasonable request from the authors.
Conflict of interest
The authors declare that they have no known competing financial interests or personal relationships that could have appeared to influence the work reported in this paper.